
How an ETF Approval Could Impact Bitcoin's Price - Charts
In this guest feature, Woo explores how the bitcoin market might react if a long-awaited ETF was approved and millions in new capital were injected into the market overnight.
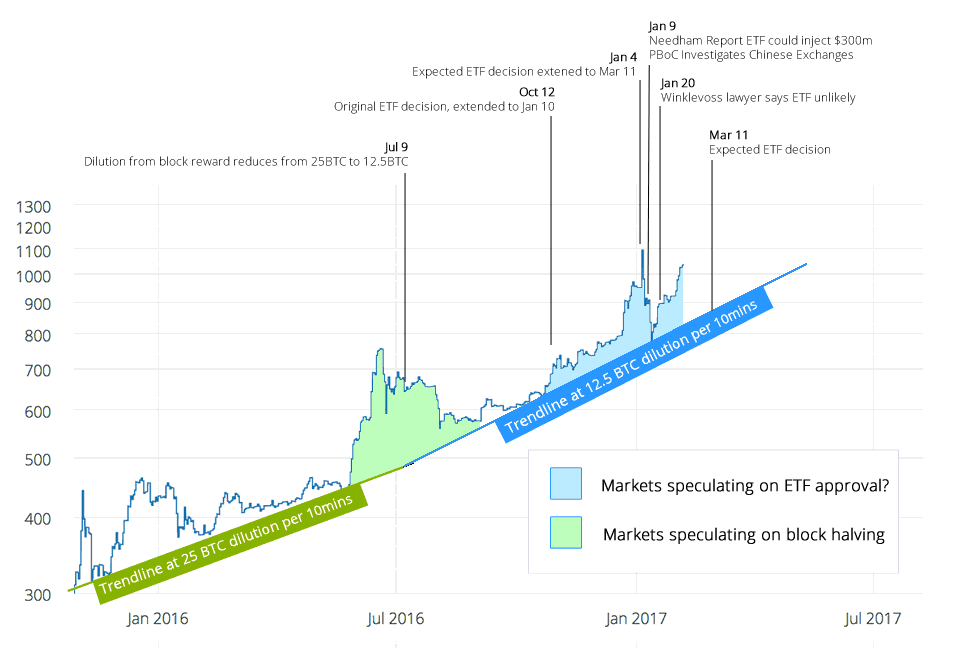
This infographic of bitcoin's price is something I've been pondering today.
It tells bitcoin's often dramatic price story in fundamental trend lines that abstract away some serious doses of speculative activity.
There's a lot in this chart, so lets break it down:
In late 2015 through to May 2016, we saw a three cats and a moon consolidation pattern play out over six months after a multi-level marketing (MMM) pyramid scheme took bitcoin price action through some exciting times.
By early June 2016, we saw a speculative bubble (marked in green above) as the market sought to price in the upcoming block reward halving event. This was to be the second halving event, slashing payout and therefore the supply of new bitcoins from 25 BTC every 10 minutes to… well, exactly half to 12.5 BTC.
Leading up to this, many people were afraid miners would exit (taking their protective hashing power with them), and that the block processing would slow and the price could crash. This did not happen. What happened was simply that the markets saw less sell-side pressure from miners who had fewer newly minted coins to sell. (The blue trend shows the steeper rate of price appreciation this had on the markets.)
Finally, what we may be seeing from Q4 2016 to present is the market undergoing a much larger and longer speculative phase for the upcoming bitcoin ETF decision. If approved, hundreds of millions at a minimum are expected to be poured into bitcoin. Understandably, the blue-shaded area in our infographic would then be drawn out.
If this story is fundamentally correct, the picture it paints is quite useful.
Methodology
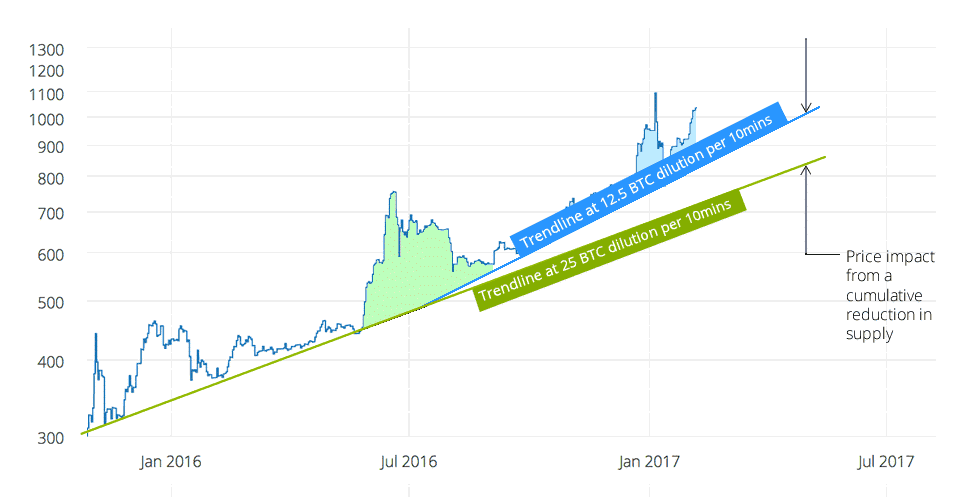
Using this data, we can deduce the impact of a controlled reduction in bitcoin supply on price, and because of this, we can use it to extrapolate changes as a result of new capital inflow.
The diagram above traces two price trajectories, and they etch out the price impact of two monetary dilution policies.
Every 10 minutes, blue supplies 12.5 BTC onto the markets, while green supplies 25 BTC. The difference between the two trend lines at any point in time will give you the price impact from their differences in supply.
The difference between the two trend lines at any point in time will give you the “fair value” price impact from their differences in supply. I say “fair value” as in reality bubble mania would take hold and we’d see a party session above the new baseline and probably another very long three cats and a moon consolidation.
First, a note about the accuracy of this method.
As any chartist and trader can attest, placement of the trend lines is an art, so bear in mind the actual results are subject to significant errors.
Nevertheless, let's see if the results make any sense…
Results and comments
Fundamental price
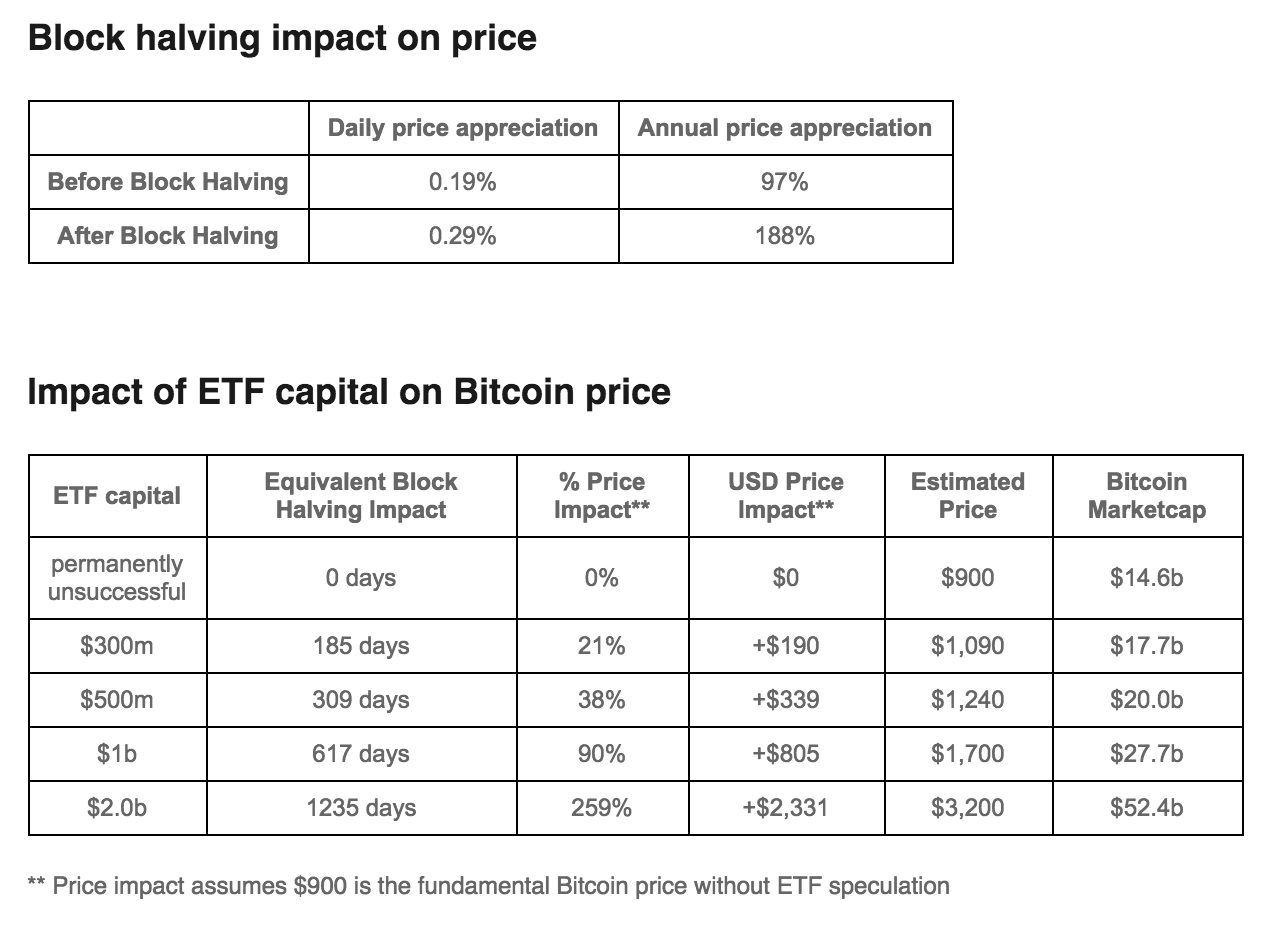
The fundamental baseline price of bitcoin, without any speculation on the day of the ETF decision came to $900.
Fundamental ROI
Our trend lines indicate bitcoin's return on investment made a step change from 97%pa to 188%pa after the block halving event, which saw monetary inflation reduce from 10% to 4%.
ETF price impact and market capitalisations
Running through different capital injection scenarios, we have predictions of between $1,090 for a $300m capital injection to $3,200 for a $2bn FOMO stampede. In comparative terms, gold ETFs account for 0.6% of gold market cap while a single $300m ETF inflow would account for 2% of bitcoin market cap.
Current market speculation
Needham and Company published a report early this year estimating that an ETF approval was likely below 25%. However, at the time of writing, the newly released BitMex EFT prediction market is expecting a 33% chance. We've seen speculative bitcoin pricing in the range of $1,050-$1,150 and success probabilities of 25% to 33%, figures that are in line with a $500m-$1bn capital injection from ETFs. In such a scenario, we would see bitcoin's market cap swell to $20bn-28bn.
What does this mean in terms of March 2017 price action?
When the results become known on 11th March, the markets will respond sharply due to speculative pricing*. Let's say the price of bitcoin is $1,090 leading up to the announcement. An approval decision could see an immediate $380-$570 price climb**, conversely with a negative decision slash the $190 speculative premium towards the $900 baseline. How much would depend on sentiments toward yet another shot at ETF approval.
* The short-term price would be driven by speculators, as an actual ETF fund would source the majority of bitcoins from over-the-counter markets. This means it would take some time before the impacts of reduced supply reached the bitcoin exchange markets.
** At 25% chance price should calculate as $900+$190*4 whereas at 33% probability the calculation would be $900+$190*3
How does this compare to other reports?
Needham and Company
less than 25% chance of success
$300m capital inject in the first week
No price target.
At 25% chance and a speculative pricing of $1100 pre-decision, my model would predict $1bn of longer-term capital injection and a fundamental valuation target of $1700. This is within ballpark.
Seeking Alpha
35% chance of success
Price target $3,678
Probability adjusted price $1,645.
If probability adjusted price is in fact $1,645, my model would predict a fair value price target of $3,125 (and $2.2bn of ETF capital).
Given their target likely accounts for speculative overshoots that always plague price mania, the two are moderately in agreement.
In this case the speculative overshoot would need to be 18%. Seeking Alpha comment the markets are undervaluing bitcoin by a wild margin (67% at the time of the report).